7.5. Business Service Topology
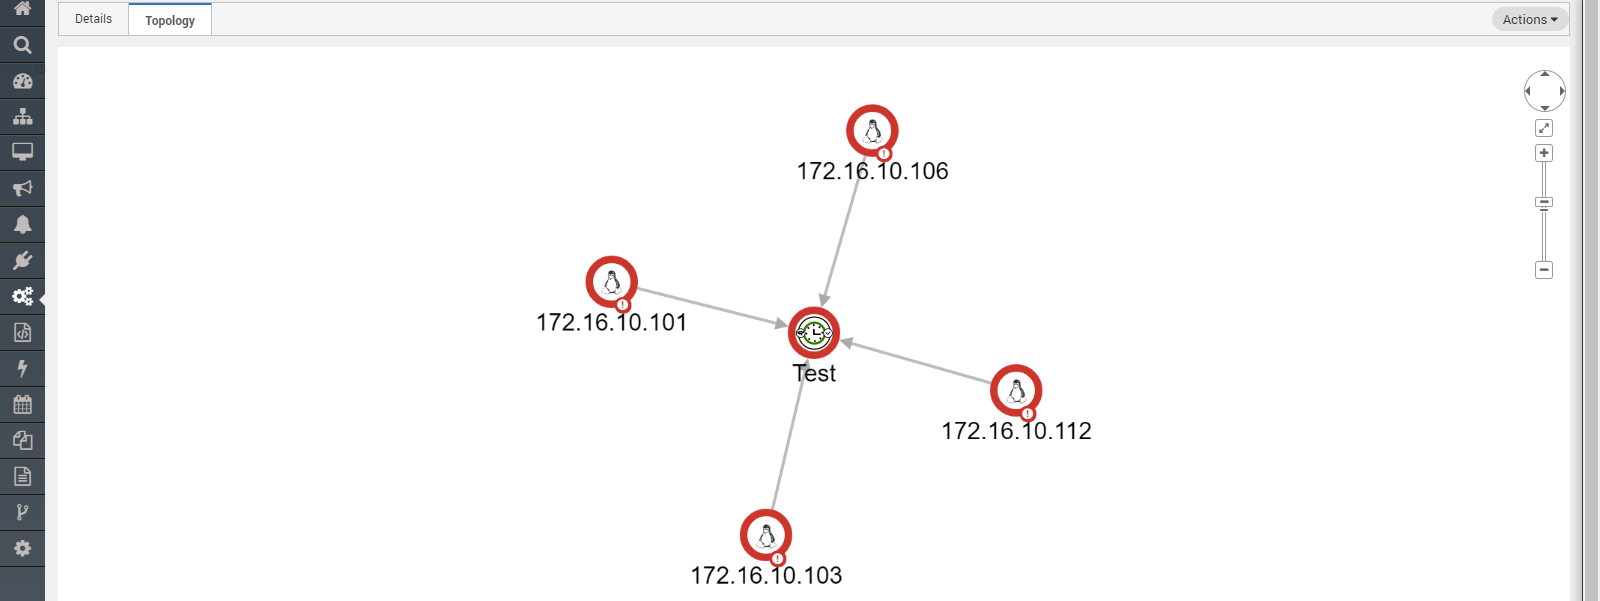
Motadata has introduced the logical BSM widget topology diagram once you create BSM and associate discovered network devices with it. For a better visualization of the monitor’s connectivity in real networks, BSM widget topology map comes handy. Motadata topology purely relies on connectivity of the nodes and links in the network.
7.5.1. Key Features
- Get the all devices into BSM Topology in Seconds.
- Auto-detect the fired alerts information to BSM topology in the form of colors displaying.
- Detect BSM and device severity and health information from the color displaying.
- Get device health information with the single click.
7.5.2. Screen Layout
The diagram shows the status of monitors using color codes. When monitor status is critical, the circle is red. When the monitor status is clear, the circle is green.

BSM Topology
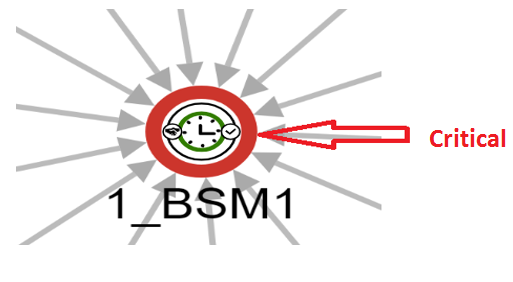
User can detect BSM health from displaying color on outer ring of BSM:

BSM Health
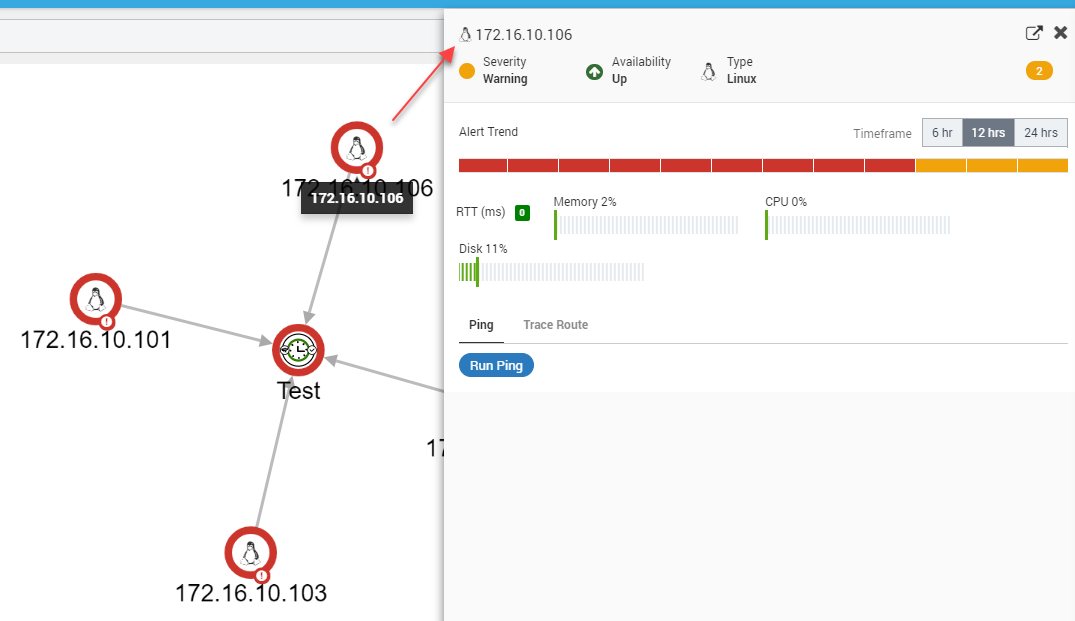
You can check monitor’s information by clicking on the monitor that will show you monitor slider.

Monitor’s Information in Topology
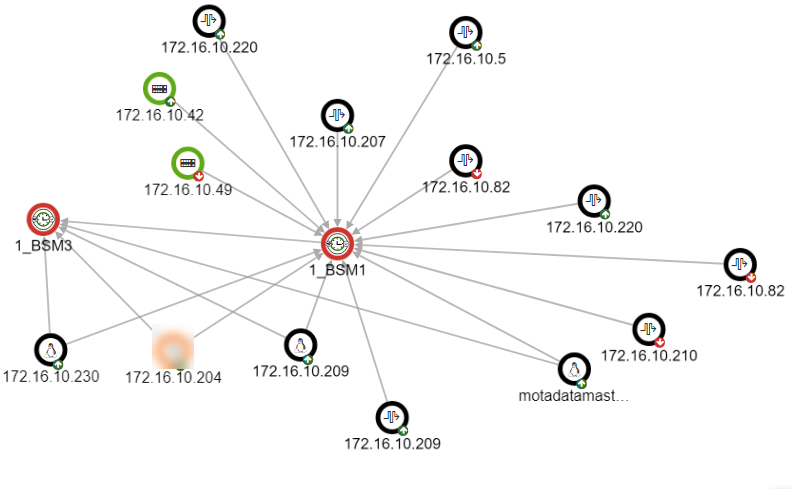
You will see nested BSM topology if BSM has children or parent BSM(s) available:

Topology with Nested BSM